INTRODUCTION
Data analysis is a procedure of segregating, analysing, cleansing and then transforming a data in order to get desired results (Mihas, 2019). There are various data analysis techniques which helps an investigator to analyse its primary or secondary data which ultimately assist them in decision making. The main aim of this report is to develop understanding about data analysis tools. In this report, humidity data for ten consecutive for the city of Cambridge, United Kingdom is taken in order to analyse it with the help of tables, graphs, descriptive statistical tools and forecasting equation.
MAIN BODY
Arranging the data in a table format
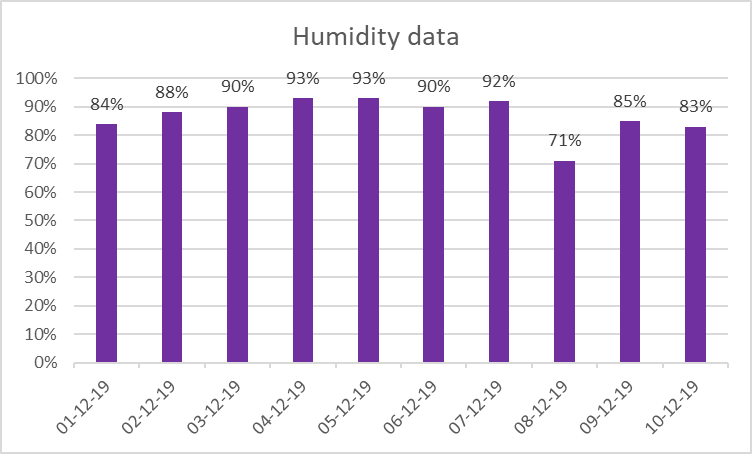
Humidity data for ten days (1 December, 2019 to 10 December 2019) is taken for the city of Cambridge, United Kingdom. The humidity data which is presented below in a table is taken at the first hour of the day which is 06:00.
|
Date |
Humidity data (%) |
|
01-12-19 |
84% |
|
02-12-19 |
88% |
|
03-12-19 |
90% |
|
04-12-19 |
93% |
|
05-12-19 |
93% |
|
06-12-19 |
90% |
|
07-12-19 |
92% |
|
08-12-19 |
71% |
|
09-12-19 |
85% |
|
10-12-19 |
83% |
(Source: Humidity level in Cambridge, United Kingdom, 2019)
Related Service - Homework Help
Presenting the data using charts
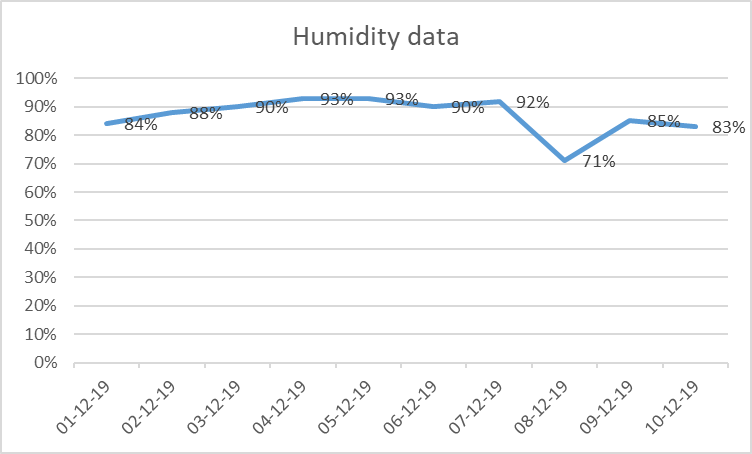
The humidity data which is presented above in a table is represent below using two graphs which are column chart and line chart.
Column chart:
Line Chart:
Calculation and discussion on the following
Mean
Mean is a tool of descriptive statistics which helps in analysing the data by determining the average of that data (Belan, 2019). Mean is usually calculated by dividing the total frequencies from the total number of frequencies. Steps and outcome of the mean against the data presented in table is presented below:
|
Mean = Sum of the frequencies/number of the frequencies M = Σx/n M = 869% /10 Mean = 87% |
From the above calculation steps of mean, it is observed that Cambridge region of United Kingdom has average humidity level of 87%.
Median
Median is the middle frequency of the data. This is a technique which helps in gaining the middle value of the dataset. This measure is generally used to ascertain the average value when the data include exceptionally high or low values. The steps of the calculation of median are presented below:
|
Median = (n + 1)/2 = 10+1/2 = 5.5 position Median = 91.5% |
Mode
Mode is the statistical measure which shows the most recurring value from the data set. It helps in analysing the frequency or value which is highly repeated value. In the case of small data, it is usually calculated by simply observing the recurring value.
|
In the given data, there are two modes which are 90% and 93% as both of these values are recurring two times. 90% is recurring at 3rd and 6th position. And 93% is recurring at 4th and 5th position. Mode = 90%, 93% |
Range
Range is the area of variation between upper and lower limit from a particular data set. This statistical measure helps in ascertaining the scope at which frequencies of the data set varies. Range is usually calculated by comparing the maximum value of the data set from minimum value of the data set. For the data set of humidity level for ten days, range is calculated below:
|
Range = Maximum band value – Minimum band value = 93% - 71% Range = 22% |
From the above calculation of range, it has been ascertained that the maximum value of the humidity level of data is 93% and minimum is 71% and the difference between these two are 22% which shows that the values of data varies only by 22%.
Standard Deviation
It is the measure which ascertains the amount of variation or dispersion of a set of values. It is a quantity expressing the group which is spread out of mean of the whole data set. Standard deviation is usually calculated as subtracting the mean value from each value of the data set and then square the result (Lu, 2015). The squared value is then divided by the total number of values minus one to get a square root value. For the data set of humidity level of Cambridge, standard deviation is computed as follows:
|
Standard Deviations =√ (variance) Variance 2 = {∑ (x – mean) / N}2 = {∑ (x2 / N – (mean)2} = {759% / 10 – (87%) 2} = {75.917% – 75.516%} = 0.401 Std. Dev. = √0.401 Standard deviation = 0.63 |
From the above calculation, it can be said that the standard deviation of the data of set of humidity level is 0.63. This low standard deviation shows the values of data set are close to the mean and there is low standard of error.
Using the linear forecasting model to calculate the following
|
Date |
Day (X) |
Humidity data (%) (Y) |
XY |
X^2 |
|
01-12-19 |
1 |
84% |
84% |
1 |
|
02-12-19 |
2 |
88% |
176% |
4 |
|
03-12-19 |
3 |
90% |
270% |
9 |
|
04-12-19 |
4 |
93% |
372% |
16 |
|
05-12-19 |
5 |
93% |
465% |
25 |
|
06-12-19 |
6 |
90% |
540% |
36 |
|
07-12-19 |
7 |
92% |
644% |
49 |
|
08-12-19 |
8 |
71% |
568% |
64 |
|
09-12-19 |
9 |
85% |
765% |
81 |
|
10-12-19 |
10 |
83% |
830% |
100 |
|
Total |
55 |
869% |
4714% |
385 |
Calculation of m value
|
Particulars |
Details |
|
m |
NΣxy – Σx Σy / NΣ x^2 – (Σx)^2 |
|
(10 * 4714) – (55 * 869) / (10 * 385) – (55)^2 |
|
|
(47140 – 47795)/ (3850 – 3025) |
|
|
m |
-0.793 |
Calculation of c value
|
Particulars |
Details |
|
c |
Σy - m Σx / N |
|
(869 – (-0.793 * 55))/10 |
|
|
c |
-89.52 |
Forecasting humidity level (y=mx+c)
|
Forecast of 15th day |
|
|
y |
= mx + c |
|
y |
-0.793 (x) +(-89.52) |
|
x |
15 |
|
y |
-0.793 (15) +(-89.52) |
|
77.625 |
|
|
Forecast of 20th day |
|
|
y |
= mx + c |
|
y |
-0.793 (x) +89.52 |
|
x |
20 |
|
y |
0.793 (20) +89.52 |
|
73.66 |
|
The linear equation of y=mx+c is used to forecast future values by using a linear data set (Dong, Sun and Li, 2017). In this case, data set of humidity level is used in which humidity level of 10 days is used, from which humidity level of day 15th and 20th is calculated. Humidity level in Cambridge, UK for the 15 day or 15 December, 2019 is 77.625% and 73.66% for 20th day.
CONCLUSION
From the above report, it has been concluded that data analysis can be used to analyse the data by using statistical tools. It has been observed that tools of forecasting, mean, mode, median standard deviation etc. can help an investigator to get desired result from the data.
You may also like to read about - Information System Project Management
REFERENCES
- Belan, S., 2019. Median and Mode in First Passage under Restart. arXiv preprint arXiv:1906.05619.
- Dong, Q., Sun, Y. and Li, P., 2017. A novel forecasting model based on a hybrid processing strategy and an optimized local linear fuzzy neural network to make wind power forecasting: A case study of wind farms in China. Renewable Energy. 102. pp.241-257.
- Lu, J., Microsoft Technology Licensing LLC, 2015. Iteratively calculating standard deviation for streamed data. U.S. Patent 9,069,726.
- Mihas, P., 2019. Qualitative data analysis. In Oxford Research Encyclopedia of Education.

UPTO56%
Avail The Benefit Today!
To View this & another 50000+ free