Does the term statistical analysis make you anxious? Yes, with an endless array of types of statistical analysis, it can feel overwhelming. But do not worry, this blog will be your go-to guide!
Here, you will discover about statistical analysis, why it matters, its key types, methods with a simplified step-by-step process. So, let's dive in and break it down in a way that finally makes sense without any jargon and a focus on clarity!
What Is Statistical Analysis?
Statistical analysis is the process of collection, organization, interpretation of a vast amount of data to identify trends and relationships. It allows you to turn raw data into meaningful information for better decision-making.
So whether you want to evaluate business performance, conduct academic research or analyze trends, statistical analysis techniques provide you a structured way to understand what the numbers really mean.
Now that you understand what is statistical analysis, it is crucial to know that there are primarily two types of it.
- Descriptive statistical analysis help you summarise data using graphical tools like charts and graphs.
- Inferential statistics allows you to draw accurate conclusions and make predictions about a larger population.
But why is understanding statistical analysis important? Let us explore this further in the next section.
Why Is Statistical Analysis Important?
Statistical analysis is essential because it equips you with the tools to make sense of a huge amount of raw data. When you understand the methods, it helps you to organize and interpret data accurately. Also, these methods guide you to select the right approach to analyze data and hence make informed decisions.
Moreover, when you explore different statistical analysis techniques, you apply the most suitable tools based on your data type and research questions. It gives you the ability to extract helpful insights and present your results with clarity.
It helps you uncover hidden patterns and relationships within the numbers. Subsequently, when you master this process, it helps you develop critical thinking skills that are beneficial across different fields.
Now that you know the importance of it, let us explore the different types of statistical analysis. Knowing them will give you the confidence to handle data effectively and succeed in both your academic journey and future career.
Statistical Types GuideWhat Are the Different Types of Statistical Analysis?
Have you ever thought about how researchers make sense of huge amount of data? Well, it all comes down to different types of statistical analysis, where each type plays a specific role. Some help you describe data, while others help you make predictions and uncover patterns. The following section tackles each one in detail.
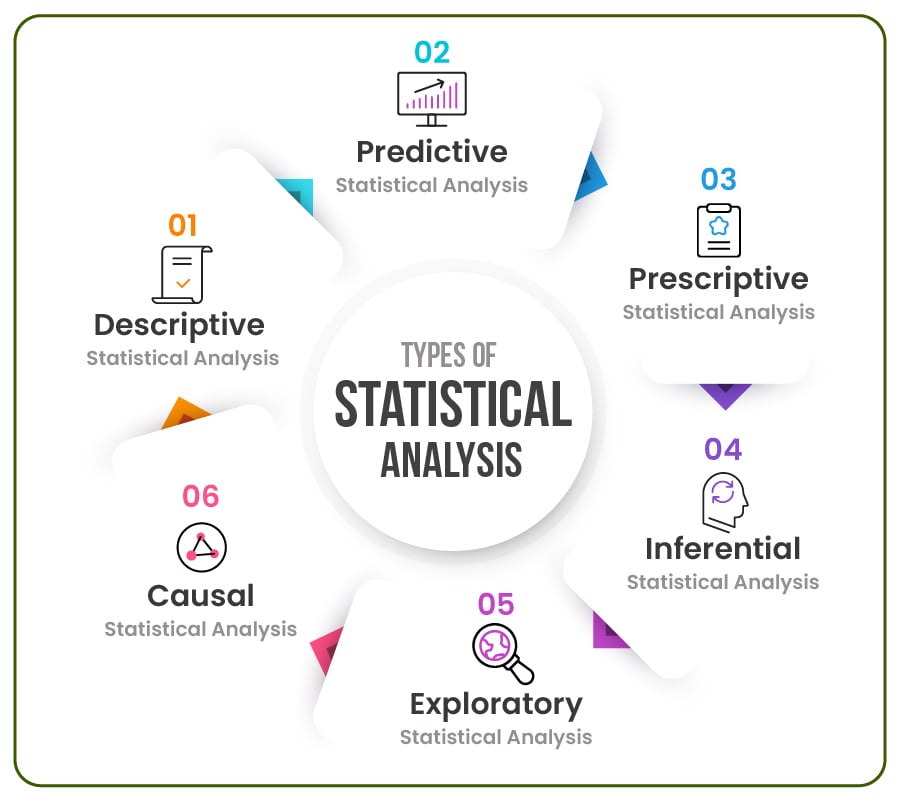
Descriptive Statistical Analysis
Descriptive statistical analysis helps you to summarize raw data in a straightforward way. It uses charts and graphs to present data.
Also, this helps you to break down massive data into small pieces with the calculation of frequencies, averages and range. The purpose of this statistical analysis process is to present the information in an accurate and meaningful order.
- Helps you understand basic features of the dataset.
- Uses measures like mean, median and mode and charts
- Summarise and organizes data to show trends or patterns
Predictive Statistical Analysis
Prescriptive analysis uses old data to predict future outcomes. This type of statistical analysis helps companies use data to make informed decisions from several alternative courses of action. For example, a company might analyze previous sales data to predict how much product they will sell next month.
Nonetheless, drawing an accurate conclusion from a historical task is not as easy as it seems. So, it uses a range of statistical data techniques such as advanced analytics, predictive modelling and data mining to make an informed prediction.
- Uses models like time series and regression
- Predicts the future outcomes based on past data
- Helps you identify trends and make good decisions
Prescriptive Statistical Analysis
Prescriptive analysis informs you about the best course of action that you need to take to achieve desired results. It suggests other courses of action after a deep analysis of data.
For instance, a school could use prescriptive analysis to decide the best study plan for students. This way, it can make wise choices and get better results. But do you know what else is a wise choice? Getting cheap assignment help from expert writers with affordable pricing and on-time delivery.
- Suggests you the best decision based on data
- Combining predictive models with techniques
- Helps you make informed decisions to achieve specific goals efficiently
Inferential Statistical Analysis
Inferential analysis helps you draw conclusions about a population on the basis of a data sample. It is a valuable method to test hypotheses to find potential errors in the data.
In short, it helps to find if the observed patterns exist in the entire population or not. For instance, a school studies the test scores of a group of students to make conclusions about the performance of the entire population of students. It informs how students are doing without testing everyone.
- Helps you make generalizations.
- Uses hypothesis testing, intervals, and tests.
- Draws accurate conclusions from a sample population.
Exploratory Statistical Analysis
Exploratory data analysis is the first step of the analysis process. Well, it takes place before any specific method is applied to the analysis. It is similar to inferential method.
The purpose of this is to collect the main characteristics of a dataset before making conclusions. In other words, it analyses the relationship between the data sets.
- Uses tools to find patterns.
- Scrutinize data without hypotheses.
- Helps you discover new insights and relationships in data.
Causal Statistical Analysis
Causal analysis or cause-and-effect analysis focuses on determining the cause-and-effect relationship between variables in data. It helps you find out if one thing causes another.
However, it not only explains what happened but also explains why it happened. This type of statistical analysis is crucial for making good decisions and solving problems, as it targets the root cause.
- Helps you determine how one factor influences another
- Examines cause-and-effect relationships between variables
- Uses experiments, controlled studies, and regression analysis
So, these are the major types of statistical analysis. A good comprehension of these can help you to make better decisions and solve real-world issues. Now, let's explore the step-by-step process involved in an analysis.
Step-by-Step Guide to the Statistical Analysis Process
These are the primary steps involved in the statistical analysis process.
Define your problem
The first step is to identify your research problem or the one that you want to analyze. Then, formulate a hypothesis if needed. A hypothesis is a problem that identifies the cause and effect between two elements or variables.
Data Collection
The second step is to collect the required data through primary and secondary sources. It can be surveys, online quizzes, reports and others. Also, you need to choose a data sample that represents a population.
Data Organization
The third step in this process is to organize the data that you collected. This stage involves the identification and removal of duplicate data that prevents you from getting an accurate analysis.
In addition, this step is crucial as it ensures the data and conclusions that will be drawn from the data are correct.
Data Presentation
The next step is the presentation of data. It includes the arrangement and categorization of data for easy analysis.
In this process, you can use descriptive tools to summarise the data. It helps you determine an accurate way to present your data for analysis.
Data Analysis
Data analysis includes the manipulation of data sets to identify trends and patterns. Here, you can also use statistical techniques such as regression and associational statistical analysis. The goal here is to discover meaningful patterns and relationships in the dataset.
Interpretation of Results
After the analysis, it is time to make sense of the numbers. It includes an explanation of your findings and it’s limitations. Here, you will present your results in the form of charts and graphs. The purpose is to turn raw results into actionable insights.
Drawing Conclusions
Once your data is analyzed, you need to carefully interpret the results to answer your original question. It means understanding what the numbers mean and whether your findings support or reject your hypotheses. Also, it is vital to consider any limitations, such as sample size or data quality.
Now that you have got a grasp on the basics of statistical analysis, let us dive into the four core methods that form the foundation of understanding and working with data.
But if you are faced with endless work in academics and have no time to research and write, you can take an essay writing service to receive well-polished documents.
Understanding the 4 Core Statistical Analysis Methods
It is crucial to learn the four primary statistical analysis methods to deepen your understanding of data. It will help you to make sense of complex information and draw meaningful conclusions. Let's break down each method so you can apply it with confidence.
Descriptive
As discussed above, it provides simple summaries like mean, median, mode and variability metrics such as range and standard deviation.
Why use it- To quickly understand your dataset's shape before any deep analysis.
Pro Tip: Use descriptive statistics to check for data errors or weird outliers early, such as a test score of 200 per cent. It saves your time and helps you avoid mistakes later.
Inferential
It uses sample data to draw conclusions about a larger population. The standard tools include t-tests, chi-square test and ANOVA.
Why use it- To test if observed differences such as study methods are fundamental or just random luck.
Pro tip: Always check your p-value to decide if your result is statistically significant. Usually, this means p is less than 0.05.
Regression Analysis
It studies the connection between one dependent variable and one or more independent variables. It helps to model, understand and predict outcomes. For instance, you want to predict your final grade based on the number of hours that you studied.
Why use it- To find and measure relationships, predict results, or control for multiple factors at once.
Pro Tip: Regression analysis can also help you identify which factors are not significant, allowing you to focus your energy wisely.
Multivariate Analysis
It explores the relationship among three or more variables. Moreover, it helps to uncover complex patterns and structures in data. The purpose is to explore how the variables relate to each other instead of analyzing them in isolation.
For instance, when your data involves many variables such as test scores, attendance, and sleep hours, multivariate analysis looks at them all together.
Why use it- Tosimplify complex data or find hidden patterns.
Pro tip: It can reveal groups or clusters you did not know existed, such as different types of students based on study habits and lifestyle.
So, these are the primary statistical analysis methods that are used to interpret and make sense of data. Their value lies in helping us make informed decisions, identify trends, and solve real-world problems by turning complex data into clear, practical insights.
Final Thoughts
Statistical analysis might sound complicated at first, but once you break it down, it becomes a powerful tool for making sense of the world. Whether you're working on a school project, preparing for exams, or exploring research ideas, when you know how to collect, organize, and interpret data, it can help you stand out.
With this guide, now you you have a strong foundation. So, start applying these statistical analysis methods to your projects or assignments. The more you practice, the easier it gets. Mastering statistics now will give you a significant edge in both academics and your future career.
Also, you may face issues with checking originality of your document. So, you can take help from our expert-crafted tools, like a free plagiarism checker to keep your work original and high-quality.
You can also read: How to Master Thematic Analysis: Step-by-Step Guide
Free Tools

Easy to Use Paraphrasing Tool to Simplify Complex Academic Writing
Check Now


Get Structured Outline by Professionals for Your Dissertation
Check Now
Effortlessly manage citations and references with our smart referencing tool
Check NowPrice Calculator


- Plagiarism
- Pricing
- Order Now
- Call Back
- Live Chat


Limited Time Offer
Exclusive Library Membership + Free 300$ Wallet Balance


Get $300 Now
![]() Update your Number
Update your Number

Thank you for submitting your comment on this blog. It is under approval. We will carefully review your submission and post it on the website.